
 CZ
CZ SK
SK HU
HU AT
AT DE
DE ES
ES SI
SI HR
HR
Nothing in the basket.

- Search
-
Login

-
0
Comparison
Add products to compare, then they will appear here and you can compare parameters.
-
0
0 €
Sharpness indicator by Ivan Putora (7A10)
SKU: PT7A10
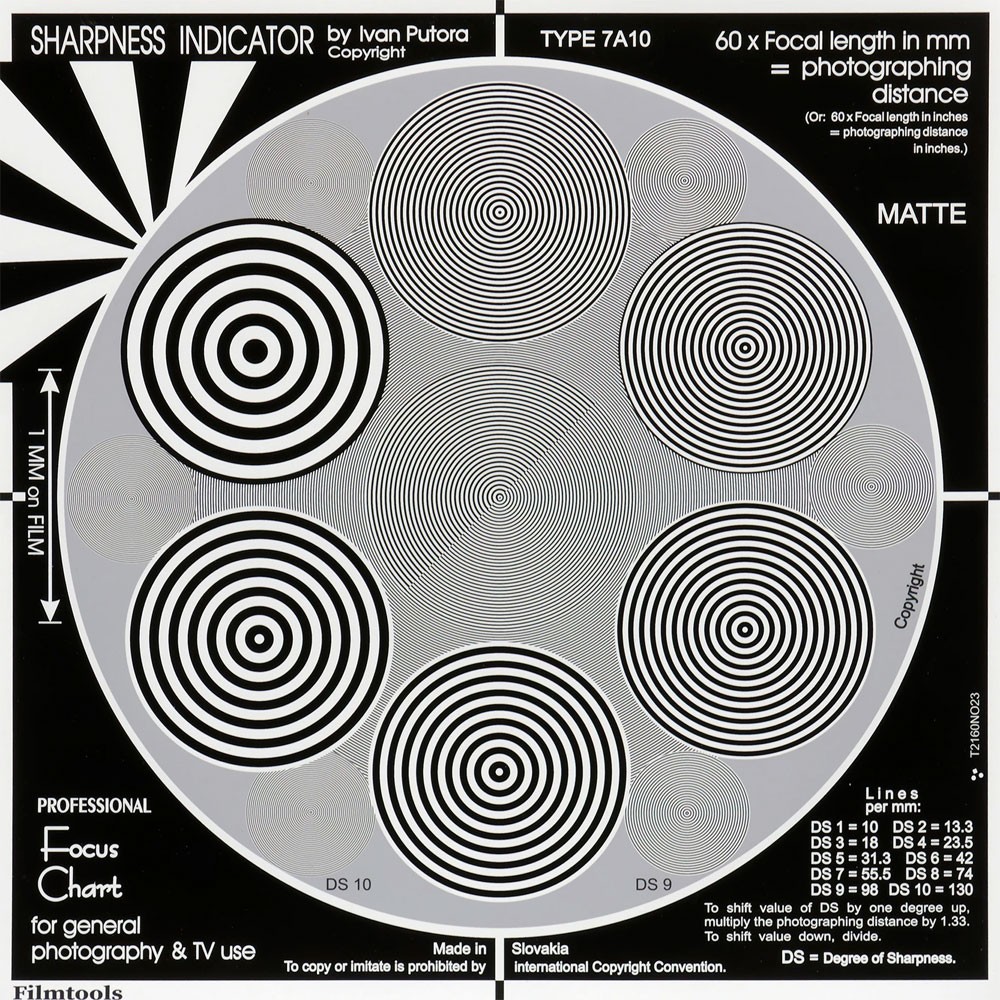
The new Putora 7A10 Sharpness Indicator model is the most advanced and accurate test chart available. Any photographer will be able to accurately evaluate the sharpness and resolution of all types of film, video and camera. The sharpness indicator consists of test targets with concentric circles printed on the background at the level of the reference field.…
73 € with VAT
60.33 € without VAT
Availability
Shipment day: Tomorrow
Shipment day: Tomorrow
To be sent > 5 pcs
Bratislava > 5 pcs
Bratislava > 5 pcs
Product description
Product description
The new Putora 7A10 Sharpness Indicator model is the most advanced and accurate test chart available. Any photographer will be able to accurately evaluate the sharpness and resolution of all types of film, video and camera. The sharpness indicator consists of test targets with concentric circles printed on the background at the level of the reference field. The background has the same reflectivity as the average reflectivity of the targets. When the target appears to blend into the background, the table shows that the target is out of focus of the system under test.
Given the fact that technology has advanced, I tried to reorganize the picture. DS1 is on the edge and DS 10 is in the center, which is 130 ciar per mm assuming the sensing distance as required. True, the S.I. can also be scanned from a different distance, e.g. when checking the sharpness between the actor and the camera, or another object. The grey area around the areal frequencies, is an essential feature of the Putora Sharpness Indicator. It is completely neutral, and can be used as a substitute for 18% gray when the aperture is opened 3/4 less than the measured value, by a spot meter. This applies to film. Also in the TV process, information about the neutrality of the gray, or its degree of darkness, is very helpful.
The PUTORA 7A10 Sharpness Indicator is a professional test chart designed to accurately evaluate lens and camera sharpness, resolution, and focus performance. Ideal for filmmakers, broadcast operators, and photographers, it provides a precise, repeatable way to check image quality, compare lenses, and calibrate camera setups for consistent, high‑end results.
The PUTORA 7A10 Sharpness Indicator is a dedicated sharpness and resolution test chart created for serious users who want to truly understand how their lenses and cameras perform. Instead of relying on subjective impressions, this chart gives you an objective, repeatable way to measure fine detail, micro‑contrast, edge sharpness, and focus accuracy across the entire frame.
With its high‑frequency line patterns, contrast areas, and carefully designed layout, the PUTORA 7A10 reveals how well your lens resolves detail in the center and corners, how cleanly it renders edges, and whether your camera’s focus system is working correctly. It is perfectly suited for testing modern high‑resolution stills cameras, cinema cameras, and broadcast systems, making it a valuable tool for rental houses, studios, and individual professionals.
Using the chart, you can quickly see differences between lenses, identify optical issues such as softness, chromatic aberration or field curvature, and verify that your camera and lens combination is delivering the level of sharpness you expect. This makes the PUTORA 7A10 an ideal choice for anyone who wants to test new gear, compare multiple lenses, or perform regular quality checks on their equipment.
If I want to test whether my lens is really sharp – what do I need?
If you’re curious whether your lens is truly sharp, or you want to compare lenses in a serious, repeatable way, you need more than just shooting random scenes. You need a dedicated sharpness test chart like the PUTORA 7A10 Sharpness Indicator.
A sharpness indicator chart gives you:
-
A controlled, repeatable target
-
Clearly defined fine detail patterns
-
A way to see center vs. corner performance
-
A reliable method to check focus accuracy and lens behavior
With this chart, you can move from “I think this lens is sharp” to “I know exactly how sharp it is and where it starts to soften.”
Step‑by‑step: How to use the PUTORA 7A10 to test lens sharpness
1. Prepare the environment
-
Mount the chart on a flat, stable surface (wall or stand).
-
Position it at comfortable eye level.
-
Use even, soft lighting from both sides to avoid shadows and hotspots.
2. Set up the camera and lens
-
Place the camera on a solid tripod.
-
Align the camera so the sensor plane is parallel to the chart (no tilt).
-
Choose a realistic test distance (several focal lengths away, not too close).
3. Choose test settings
-
Use a low ISO (e.g. ISO 100–400) to avoid noise.
-
Turn off heavy in‑camera sharpening or special effects.
-
Start at a mid aperture (e.g. f/4–f/5.6) – usually the sharpest range.
-
For zoom lenses, test at wide, mid, and tele focal lengths.
4. Focus carefully
-
Use single‑point AF on the center of the chart or precise manual focus.
-
For critical testing, use magnified live view to confirm focus.
-
Take several shots to ensure consistency.
5. Capture images or video
-
Shoot multiple frames at different apertures (wide open, mid, stopped down).
-
For video cameras, record short clips at your normal production settings.
6. Analyze the results
On a good, calibrated monitor:
-
Check center sharpness – fine lines should be crisp and clearly separated.
-
Check corner sharpness – look for softness or loss of detail at the edges.
-
Examine micro‑contrast – tiny patterns should look clean, not muddy.
-
Look for chromatic aberration – colored fringes around high‑contrast edges.
-
Note how sharpness changes with aperture and focal length.
This process will show you exactly how your lens behaves: where it is strongest, where it starts to soften, and whether it meets your expectations for professional use.
Alternative (1)
Alternative (1)
Acuity Indicator (Type 7A9)
The Putora acuity indicator is the most advanced and accurate test chart. Any photographer
73 €
To be sent > 5 pcs
News, training, and discounts from Syntex
Special offers and discounts for subscribers only · Free audio & video workshops · News and tips from the world of filmmaking
- Show all
Sharpness indicator by Ivan Putora (7A10)
The new Putora 7A10 Sharpness Indicator model is the most advanced and accurate test73 €To be sent > 5 pcs