
 CZ
CZ SK
SK HU
HU AT
AT DE
DE ES
ES SI
SI HR
HR
Nothing in the basket.

- Search
-
Login

-
0
Comparison
Add products to compare, then they will appear here and you can compare parameters.
-
0
0 €
Acuity Indicator (Type 7A9)
SKU: PT-7A9
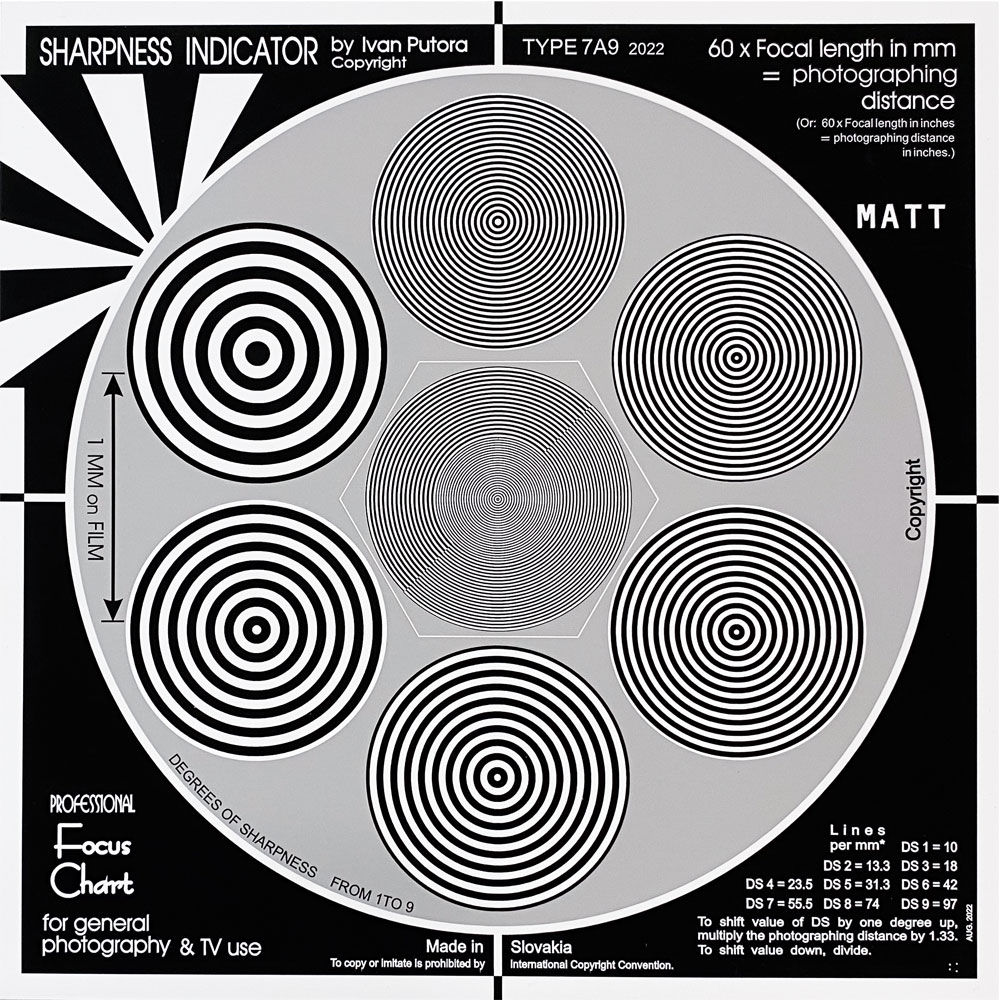
The Putora acuity indicator is the most advanced and accurate test chart. Any photographer will be able to accurately evaluate the sharpness and resolution of all types of film, video and camera.The sharpness indicator consists of test targets with concentric circles printed on the background at the level of the reference field. The background has the same…
73 € with VAT
60.33 € without VAT
Availability
Shipment day: 26. 10.
Shipment day: 26. 10.
To be sent > 5 pcs
Bratislava > 5 pcs
Bratislava > 5 pcs
Product description
Product description
The Putora acuity indicator is the most advanced and accurate test chart. Any photographer will be able to accurately evaluate the sharpness and resolution of all types of film, video and camera.The sharpness indicator consists of test targets with concentric circles printed on the background at the level of the reference field. The background has the same reflectivity as the average reflectivity of the targets. When the target appears to blend into the background, the table shows that the target is out of focus of the system under test.
The PUTORA 7A9 Sharpness Indicator Chart is a professional resolution and focus‑testing tool designed for filmmakers, broadcast operators, and photographers who need precise, repeatable image‑quality evaluation. Ideal for camera and lens calibration, it helps you quickly identify sharpness, micro‑contrast, chromatic aberration, and focus accuracy across the entire frame. Perfect for studio, rental, and production environments where consistent, high‑quality results matter.
The PUTORA 7A9 Sharpness Indicator Chart is an essential tool for anyone who demands reliable, scientific image‑quality testing in film, broadcast, and photography. Built for professional workflows, this chart allows you to evaluate the true performance of any camera and lens combination — from high‑resolution mirrorless systems like the Sony A7R V with 24–70mm GM II, to broadcast setups such as the URSA Broadcast G2 paired with Fujinon LA16.
Designed with high‑frequency detail patterns, contrast blocks, and precision alignment markers, the PUTORA 7A9 chart reveals how well your equipment reproduces fine detail, maintains focus accuracy, and handles optical challenges such as chromatic aberration, edge softness, and codec‑related resolution loss. It is widely used in rental houses, QC departments, studios, and production companies to ensure cameras deliver consistent, professional‑grade results.
Using the chart is simple: mount it securely, light it evenly, align your camera parallel to the surface, and capture images or video at different focal lengths and apertures. When reviewing the footage, you can easily assess center and corner sharpness, micro‑contrast, color fringing, moiré behavior, and backfocus accuracy — especially important for broadcast lenses. This makes the PUTORA 7A9 chart a powerful tool for camera matching, lens comparison, equipment calibration, and pre‑production quality checks.
Whether you are preparing for a commercial shoot, calibrating a multicam setup, or verifying the performance of a new lens, the PUTORA 7A9 Sharpness Indicator Chart provides the clarity and confidence needed to achieve the highest image quality in every project.
Understanding and Using the PUTORA 7A9 Sharpness Indicator Chart
What is the PUTORA 7A9 Sharpness Indicator Chart and why is it used in film and photography?
The PUTORA 7A9 Sharpness Indicator Chart is a professional test chart designed to evaluate the sharpness, resolution, focus accuracy, and optical performance of any camera and lens combination. It is commonly used in cinema production, broadcast studios, rental houses, and photography labs to verify that a camera system delivers the highest possible image quality.
This chart helps operators detect:
-
Lens sharpness (center and corners)
-
Fine detail reproduction
-
Micro‑contrast performance
-
Chromatic aberration
-
Focus accuracy
-
Backfocus issues (especially on broadcast lenses)
-
Codec or sensor detail loss
Using a chart ensures objective, repeatable, and scientific evaluation of your equipment.
How do I use the PUTORA 7A9 chart with cameras like Sony A7R V + 24‑70mm GM II or URSA Broadcast G2 + Fujinon LA16?
Using the chart is simple and follows a standard testing workflow:
-
Mount the chart flat and stable at eye level.
-
Light it evenly with soft, uniform lighting.
-
Place the camera at the correct distance (usually several focal lengths away).
-
Align the camera so the sensor is perfectly parallel to the chart.
-
Set your test settings (ISO 100–400, mid aperture, neutral profile).
-
Record or photograph the chart at different focal lengths and apertures.
-
Review the captured image on a calibrated monitor.
This procedure works for both high‑resolution mirrorless cameras (Sony A7R V) and broadcast cameras (URSA Broadcast G2).
What should I look for when analyzing the test images or video?
When reviewing the captured chart, pay attention to:
-
Center sharpness Fine lines should be crisp and clearly separated.
-
Corner sharpness Corners should remain sharp; softness indicates lens limitations.
-
Micro‑contrast Tiny black‑and‑white patterns should appear clean, not muddy.
-
Chromatic aberration Look for purple/green fringing around high‑contrast edges.
-
Moiré and aliasing Repeating patterns may reveal sensor or codec limitations.
-
Backfocus accuracy (URSA Broadcast G2 + Fujinon LA16) Zoom in → focus → zoom out → check if focus remains perfect.
This analysis helps you understand how your camera and lens perform in real production conditions.
Why is this chart useful for both photographers and filmmakers?
Because it allows you to:
-
Verify your equipment is performing correctly
-
Compare lenses and cameras under identical conditions
-
Match multiple cameras for multicam shoots
-
Detect optical issues before a job
-
Optimize your settings for maximum sharpness
Whether you shoot commercials, documentaries, live broadcast, or studio work, the PUTORA 7A9 chart ensures your gear delivers consistent, professional‑grade results.
🧪 Step‑by‑Step Technical Procedure (for both cameras)
Below is a full professional workflow using the PUTORA chart.
STEP‑BY‑STEP PROCEDURE TEMPLATE
1-Set Up the Chart Correctly
Start Here
Proper chart placement ensures accurate sharpness evaluation.
-
Mount the chart perfectly flat and vertical
-
Position it at eye level of the camera
-
Ensure the camera sensor plane is parallel to the chart
-
Use a stable tripod for both cameras
2-Light the Chart Evenly
Recommended
Uniform lighting prevents false softness or contrast loss.
-
Use two soft lights at 45° angles
-
Avoid shadows, hotspots, reflections
-
Keep illumination consistent across the entire chart
3-Set Camera Distance
Correct distance ensures the chart fills the frame without distortion.
-
Sony A7R V + 24–70 GM II: place camera 2–3 meters away
-
URSA Broadcast G2 + Fujinon LA16: place camera 3–4 meters away
-
Ensure the chart fills 70–80% of the frame
4-Configure Camera Settings
Use optimal settings for sharpness evaluation.
-
Sony: ISO 100, f/4–f/5.6, shutter 1/125, AF-S single point
-
URSA: ISO 400, f/2.8–f/4, shutter 1/60, manual focus
-
Disable sharpening, noise reduction, picture profiles
5-Perform Focus Calibration
Critical
Accurate focus is essential for valid sharpness testing.
-
Sony: use magnified manual focus or AF-S with center point
-
URSA: perform backfocus adjustment on the Fujinon LA16
-
Re-check focus after zooming (broadcast lenses shift!)
6-Capture Test Images and Video
Record multiple samples for reliable comparison.
-
Shoot at wide, mid, and tele focal lengths
-
Capture at different apertures (wide open → f/8)
-
Record still photos (Sony) and video (URSA)
-
Take at least 3 shots per setting
7-Analyze the Results
Most Important
Evaluate resolution, contrast, and optical performance.
-
Zoom to 100–200% on a calibrated monitor
-
Inspect center sharpness and corner sharpness
-
Look for chromatic aberration (purple/green edges)
-
Check micro‑contrast in fine patterns
-
Evaluate moire, aliasing, and codec softness
-
Compare sharpness at different focal lengths and apertures
8-Identify Optical Issues
Charts reveal problems you cannot see in normal shooting.
-
Backfocus errors (URSA + Fujinon)
-
Field curvature (corners sharp only at different focus)
-
Astigmatism (horizontal vs vertical lines differ)
-
Edge softness or vignetting
-
Sensor sharpening artifacts
🔍 How to Analyze the Captured Images (Detailed Guide)
1. Center Sharpness
Look at the highest frequency lines in the middle of the chart.
-
Sony A7R V should resolve extremely fine detail
-
URSA Broadcast G2 will show lower resolution due to B4 optics
If lines blend together → softness or focus error.
2. Corner Sharpness
Check all four corners.
-
Sony 24–70 GM II is very sharp even wide open
-
Fujinon LA16 will soften at edges, especially at full tele
If corners are blurry while center is sharp → field curvature or lens limitation.
3. Micro‑Contrast
Look at tiny black/white patterns.
High micro‑contrast = crisp image Low micro‑contrast = “muddy” or “flat” look
4. Chromatic Aberration
Check edges of black lines:
-
Purple/green fringing = CA
-
Sony GM II has excellent CA control
-
Fujinon LA16 may show CA at telephoto
5. Moiré & Aliasing
Look at repeating patterns.
-
Sony A7R V (high resolution) → minimal moiré
-
URSA Broadcast G2 → may show aliasing depending on codec
6. Codec Sharpness (URSA)
Compare:
-
ProRes
-
BRAW
-
Different bitrates
Lower bitrate = softer fine detail.
7. Backfocus (URSA Broadcast G2)
Zoom in → focus → zoom out → check focus.
If focus shifts → backfocus needs adjustment.
Alternative (1)
Alternative (1)
Sharpness indicator by Ivan Putora (7A10)
The new Putora 7A10 Sharpness Indicator model is the most advanced and accurate test
73 €
To be sent > 5 pcs
News, training, and discounts from Syntex
Special offers and discounts for subscribers only · Free audio & video workshops · News and tips from the world of filmmaking
- Show all
Acuity Indicator (Type 7A9)
The Putora acuity indicator is the most advanced and accurate test chart. Any photographer73 €To be sent > 5 pcs